
The most common way I fool myself with a LoRA is to test strength only on the prompts that already look good at 0.8. The adapter appears strong and controllable. Then a new client prompt arrives, the strength that “worked” produces either mush or an overfit cartoon, and I realize the test was never a test—it was a confirmation ritual.
This LoRA Workshop post is the anti-confirmation protocol I now force myself to run before I publish any weight recommendation.
The Fooling Pattern in Plain Sight
I open the strength slider, generate a few images at 0.6–0.9 with the original training-style prompts, pick the prettiest one, and declare the sweet spot. That process measures how well the LoRA reproduces its training distribution. It does not measure how the LoRA behaves when the prompt leaves that distribution. The gap between those two questions is where most production failures hide.
A Strength Sweep That Includes the Ugly Cases
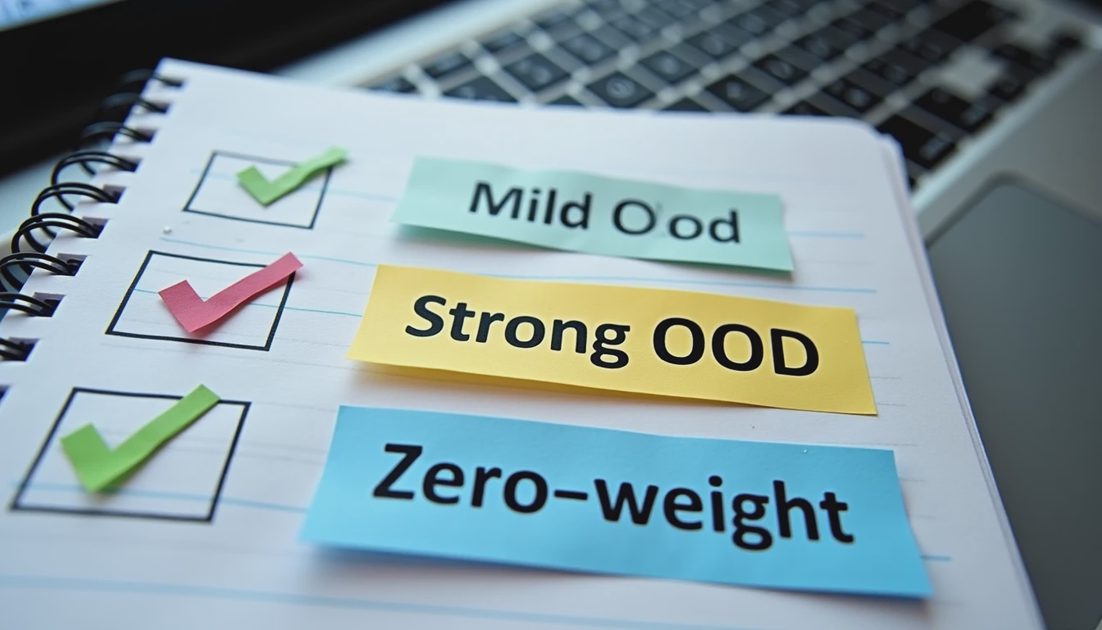
My current sweep always contains four prompt categories:
In-distribution (close to training captions)
Mild out-of-distribution (new wardrobe, same face)
Strong out-of-distribution (new environment, new lighting, new pose)
Zero-weight control (base model only)
I run the same seed family across strengths 0.0, 0.3, 0.5, 0.7, 0.9, 1.1. The 0.0 column is mandatory. Without it I cannot tell whether the LoRA is helping or simply riding a lucky base-model sample.
What I Actually Record
For every cell I note only three things:
Does the identity marker still hold?
Does the image remain usable for the intended purpose?
Does increasing strength improve or degrade the out-of-distribution prompts?
I no longer record “looks better.” That phrase is too easy to game. Usability and marker retention are harder to lie about.
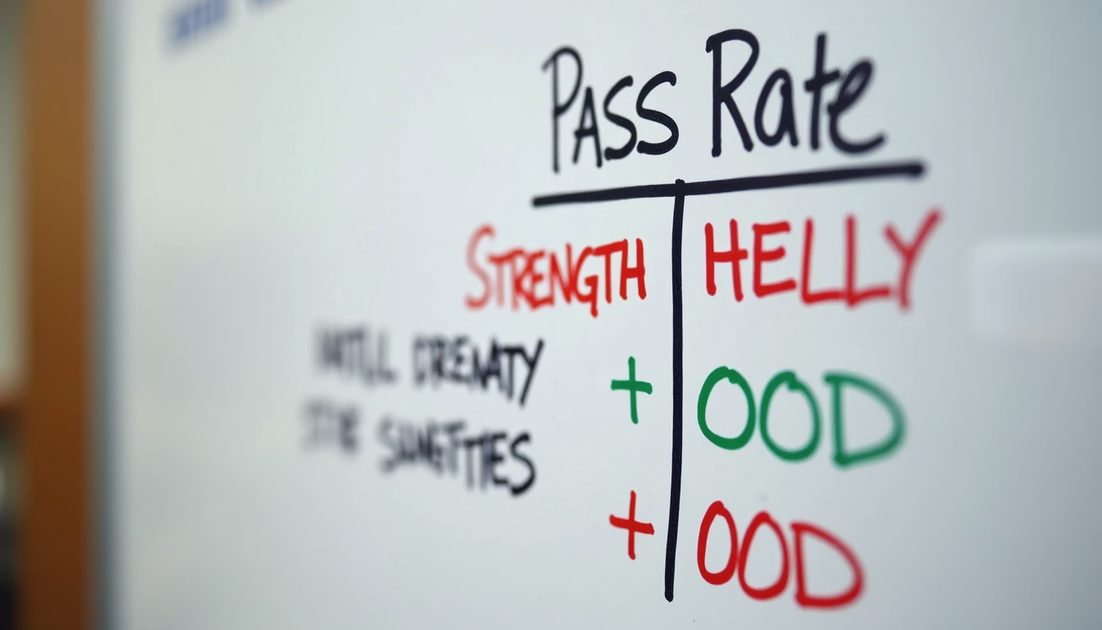
Strength | In-dist pass | Mild OOD pass | Strong OOD pass | Typical observation |
|---|---|---|---|---|
0.0 | Base only | Base only | Base only | Control reference |
0.3 | High | Medium | Low–Medium | Subtle influence |
0.5 | High | High | Medium | Often the practical ceiling |
0.7 | High | Medium–High | Low | Starts to fight new prompts |
0.9+ | High | Low | Very Low | Overfit territory |
The Recommendation I Publish
I publish the highest strength that still clears the strong out-of-distribution column at an acceptable rate. That number is almost always lower than the strength that produces the prettiest in-distribution grid. Clients who only ever generate in-distribution images can push higher; everyone else gets the conservative number with the test log attached.
Why 0.0 Belongs in Every Sweep
Leaving out the zero-weight control is the fastest way to fool yourself. A strong base-model sample can make a weak LoRA look effective, or a medium LoRA look essential. The 0.0 column removes that ambiguity in one glance.
Team Handoff Rule
If another person cannot reproduce the strength recommendation from the log alone, the test is incomplete. The log must include model version, host, exact prompt blocks, seed list, and the pass/fail table. Anything less is a personal preference, not a measured result.
Minimum Time Investment
A full four-category sweep across six strengths takes me roughly 40–60 minutes on the current host, including scoring. That is still cheaper than discovering an overfit weight after a client has already approved the first grid. I schedule the sweep as a required gate, not an optional extra. Skipping it to “save time” has never actually saved time.
Relationship to Dataset and Training Choices
Strength testing cannot fully rescue a badly biased dataset. If the training images are 90 % the same pose, even a carefully chosen strength will struggle on the missing poses. The sweep will reveal the problem early, but the lasting fix still lives in the data and the training stop point. Strength is the last dial I turn, not the first.
Publishing the Range, Not a Single Number
I now publish a recommended operating range (for example 0.35–0.55) rather than a single magic number. The lower end is the highest strength that still clears strong OOD; the upper end is the point at which in-distribution quality is still acceptable. Operators who only generate in-distribution images can sit higher; everyone else stays inside the published range. The log always includes both ends so the choice is informed.
Run the test. Save the settings. Show the failure. Strength is not a slider you set by eye. It is a measured range that survives prompts the training set never saw.
How I Score a Single Strength Cell
For each strength value I generate a fixed six-image probe: three in-distribution, three deliberately out-of-distribution. I mark each image pass or fail against a short checklist (identity retained, no new artifacts, requested attribute present). A strength is accepted only if at least five of the six cells pass and the single failure, if any, is a known limitation already documented on the recipe card. This binary scoring removes the temptation to average away a bad cell because “the other five looked great.”
A Common Self-Deception Pattern I Still Catch Myself In
I generate a beautiful grid at strength 0.8, fall in love with the detail, and only later run the OOD probes that show the face has drifted. The emotional sequence is always the same: early aesthetic reward, delayed measurement, quiet regret. The only reliable counter is to run the zero-weight and OOD cells first, before any high-strength hero images are allowed on the screen. Reversing that order has prevented more than one over-committed recipe.
No comments yet.